Georgia’s Agricultural Sector: Analyzing Indicators and Challenges

Introduction
Georgia’s agricultural sector is often a subject of animated discussions among political and economic circles, although academic analysis and transforming this analysis into policy really is not a common practice. Therefore, it is vital to have more academic, evidence-based debates which will leave a little space for populism and curb politically-motivated thinking in economic decision-making to a minimum.
Agricultural sector consists of farming crops, animal husbandry and fishery. It is the only source of food sector and it depends on agriculture when the final costumer will get final products in what amount as well as in what quality and at what price. Before the collapse of the Soviet Union, over the course of 70 years, the government used to make centralized decisions in this regard and after the disintegration of the USSR, Georgia had to switch to a market economy in a very short period of time which entailed numerous painful consequences. The reason of that, first and foremost, was economically, systemically and morally unfair and unjustified totalitarian system and on the other hand it was a number of wrong political decisions during the transition period and afterwards.
There are a number of components that are used for comprehensive analysis of the sector, although the most important ones are as follows:
- Wealth generated by the sector and its share in a country’s economy;
- Real economic growth of the sector year-by-year;
- Number of people employed in the sector and their incomes;
- Efficiency of the sector vis-à-vis other sectors;
- Size of an average farm.
Wealth Generation and Share in a Country’s Economy
Agricultural sector occupies a significant share in the Georgian economy. Total output of the sector in 2022 amounted to GEL 7.1 billion and wealth contribution to the GDP reached GEL 4.4 billion. This accounted for 7% of Georgia’s total GDP.
Graph 1: Agricultural Sector’s Nominal and Percentage Indicators in the Gross Domestic Product
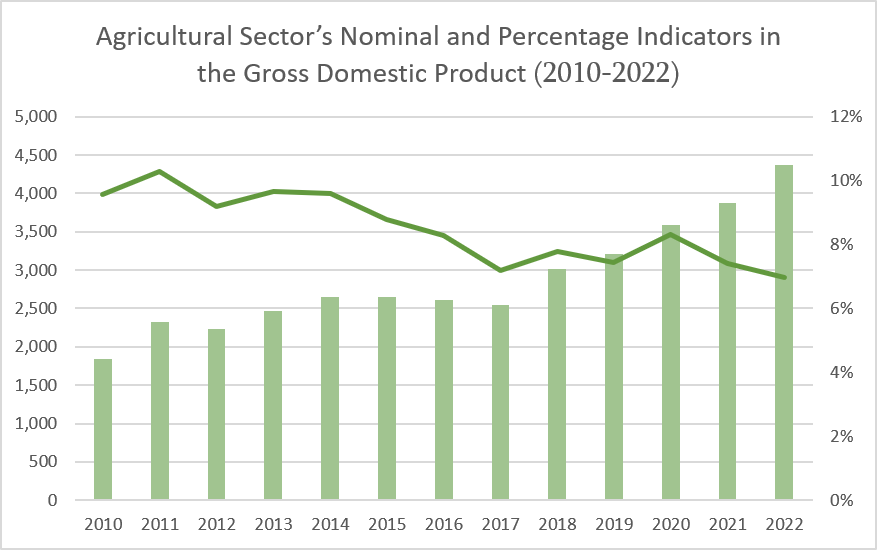
Source: National Statistics Office of Georgia
It is shown by the Graph 1 that the agricultural sector’s output has been increasing in 2010-2022 and average growth rate was 7.8%. However, measuring this figure in a nominal value is academically less justified and it is important to analyze figures that are corrected against price growth (are adjusted to inflation). The average growth rate of agriculture sector’s contribution to the GDP in 2015 prices was merely 2.7%.
Graph 2 clearly illustrates that agricultural sector’s share in economy gives an important information about a country’s development stage. The less the share the more developed a country is.
Graph 2: Agricultural Sector’s Share in the GDP and GDP Per Capita (PPP), 2021
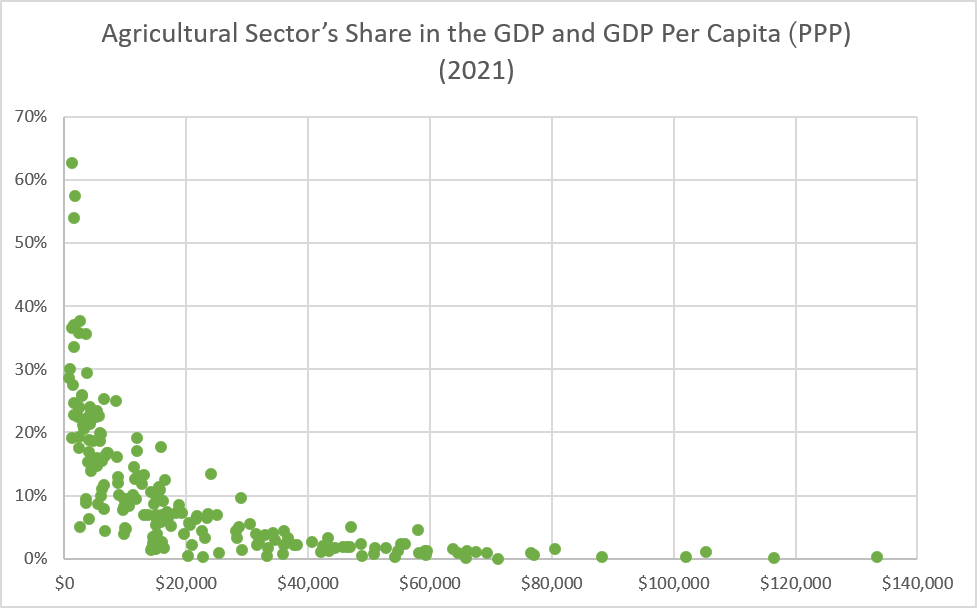
Source: World Bank; author’s calculations
Graph 2 shows correlation between GDP per capita and share of agricultural sector in the GDP across 185 countries as of 2021. Statistical correlation between these two variables is 0.60.1% which is a strong correlation. This outcome is attributable to a number of factors, such as – the richer a person the less is payments for food to total income ratio. In addition, labor in agricultural sector is associated with harder working conditions whereas together with wealth accumulation, a country starts to have more high-tech jobs. The third major reason is urbanization. In time, and other things being equal, countries’ rate of urbanization tends to grow.
In accordance with the World Bank, Georgia’s GDP per capita (PPP) was USD 17,000 in 2021 whereas the agricultural sector’s share in the economy was 6.5%. Countries with similar GDP per capita figures are in the same situation too. For instance, in case of Bosnia and Herzegovina it is 5.2%, in case of North Macedonia 7.2%, in case of Columbia 7.4% and in case of Mexico 3.9%. With respect to the countries of Georgia’s region, the picture is as follows:
Table 1: Georgia and Countries of the Region
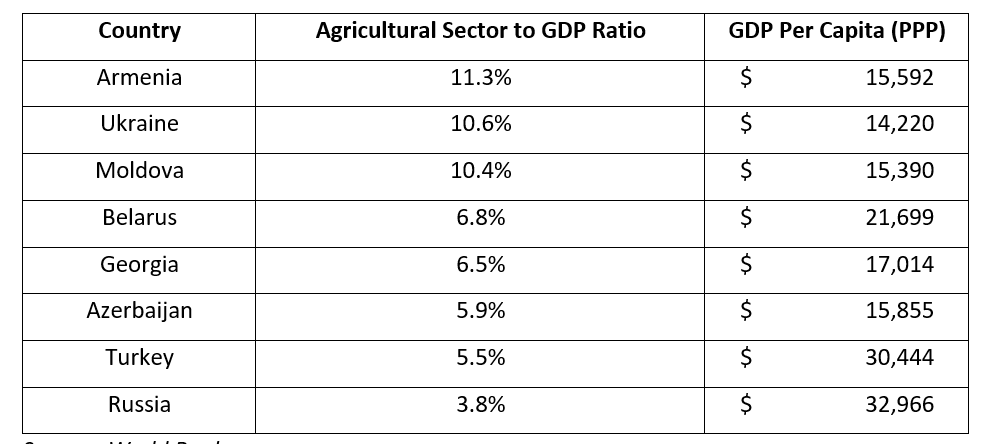
Source: World Bank
Agricultural Sector’s Real Economic Growth Year-by-Year
Real economic growth rate provides the clearest reflection of the agricultural sector’s development, because it excludes the inflation rate and shows real growth of output annually.
Table 2: GDP and Real Growth of the Agricultural Sector in the GDP, 2011-2022
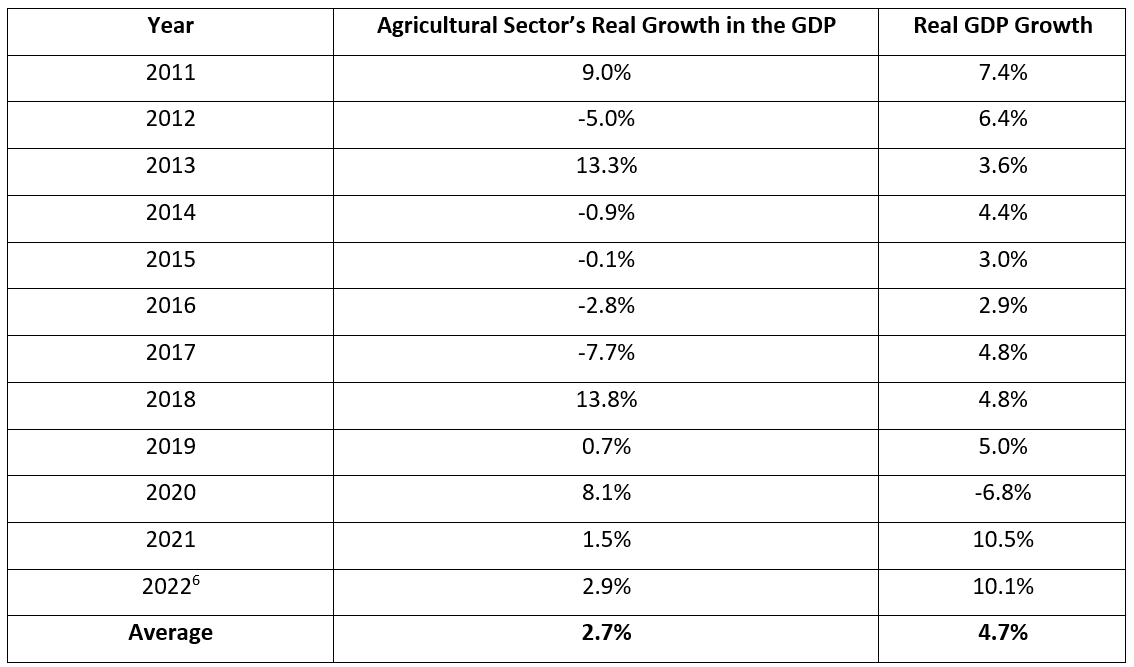
Source: National Statistics Office of Georgia
Table 2 shows that in 2011-2022, Georgia’s agricultural sector was growing by 2.7% on average whereas the country’s economic growth rate was 1.7 times higher at 4.7%. This indicates that the agricultural sector is on average much less successful as compared to other sectors of the Georgian economy. This trend persisted in 2021 and 2022 as well. As Georgia’s economy grew by 10.5% in 2021, growth of the agricultural sector was seven times less at 1.5% and in 2022 it was 3.5 times less.
On top of average growth indicators, agricultural sector’s growth is characterized by sharp fluctuation. For instance, 7.7% decrease in 2017 was followed by 13.8% growth in 2018 which indicates small size and instability of the sector. Standard deviation of the agricultural sector’s real economic growth in 2011-2022 was 6.6 percentage points.
Number of People Employed in the Sector and Their Revenues
In 2022, Georgia’s total workforce was 1.55 million people. Of that amount, 1.28 million were employed. Some 230,000 people were employed in the agricultural sector which constituted 19% of the total employment.
Table 3: Distribution of Employed Persons by Economic Activity, 2021
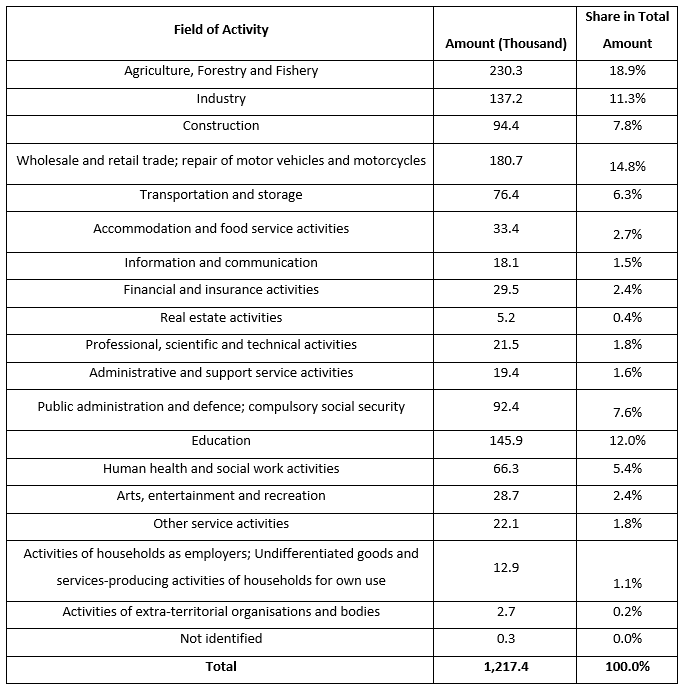
Source: National Statistics Office of Georgia; author’s calculations
Diagram 1: Sectoral Employment, 2021
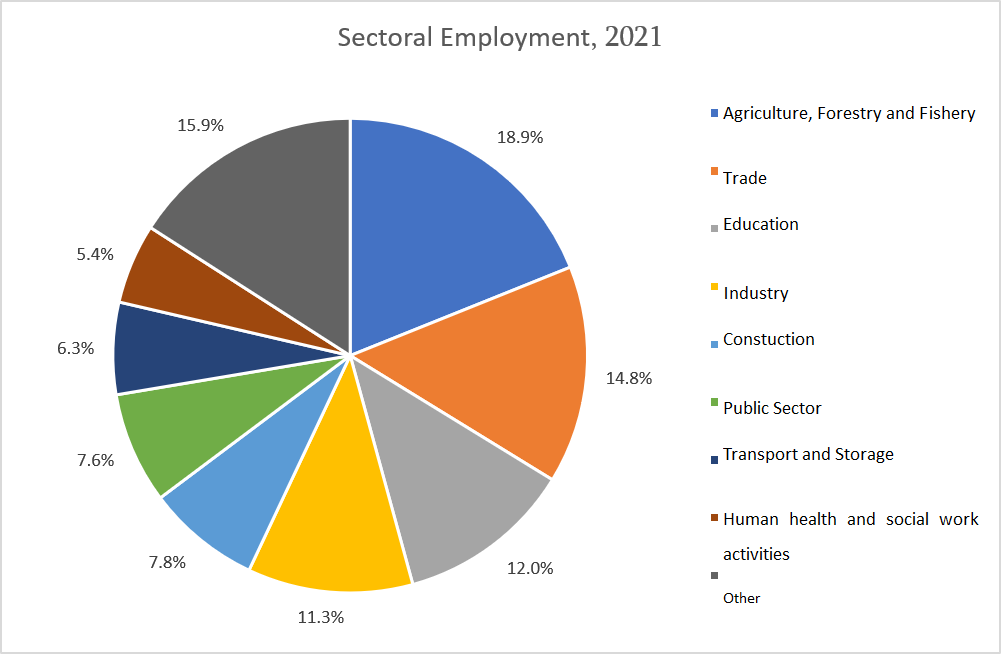
Source: National Statistics Office of Georgia; author’s calculations
As Table 3 and Diagram 1 illustrate the agricultural sector is the biggest employer at the job market. There are more people employed in the agricultural sector as compared to trade (50,000 people more).
Of note is that according to the information of the National Statistics Office of Georgia, employment in agriculture in 2019 was 43% and situation at that time was much worse as compared to present day. After updating its methodology, the National Statistics Office of Georgia removed hundreds of thousands of people from workforce and therefore, employment in the agricultural sector dropped sharply. In 2019, share of self-employed individuals in total employment was 49.7% which contracted to 30.7% in 2020.
Taking a glance at the comparison with the other countries, it is obvious that share of the agricultural sector in the economy as well as employment in the agriculture sector decreases in relation to a country’s wealth per capita.
Graph 3: Employment in the Agricultural Sector (%) and GDP Per Capita (PPP)
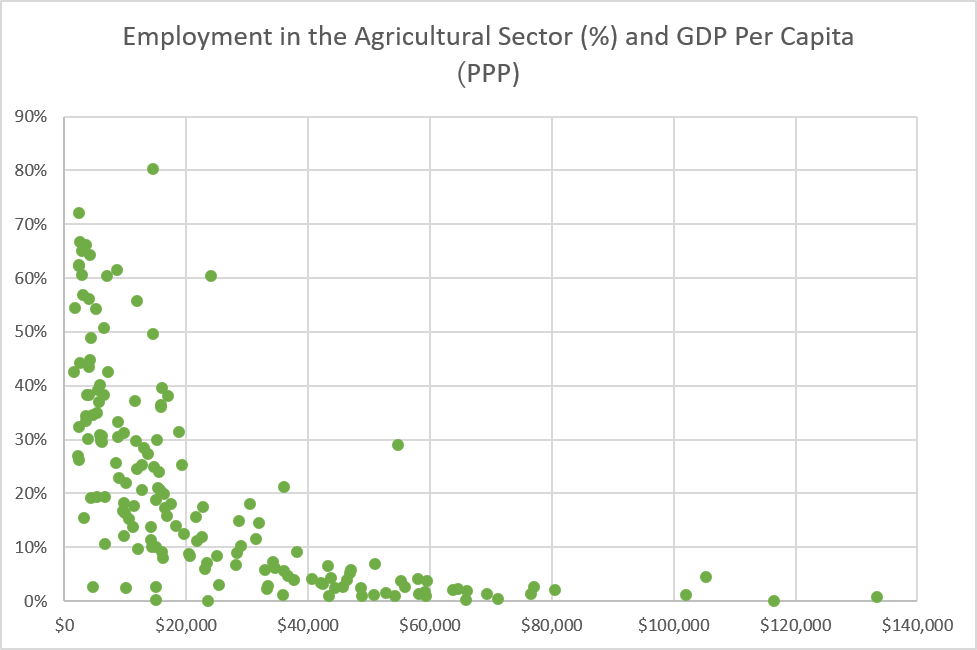
Source: World Bank
Graph 3 illustrates that of 175 countries, the richer a country is per capita the less is agriculture employment to total employment ratio. The value of correlation between two variables is 64% which statistically is considered to be a strong correlation.
In countries with similar to Georgia’s GDP per capita (PPP), employment in agriculture is lesser albeit slightly. It is 18% for Bosnia and Herzegovina, 15.8% for Columbia, 14% for Norther Ireland and etc. Data of the regional countries is as follows:
Table 4: GDP Per Capita (PPP) and Employment in Agriculture
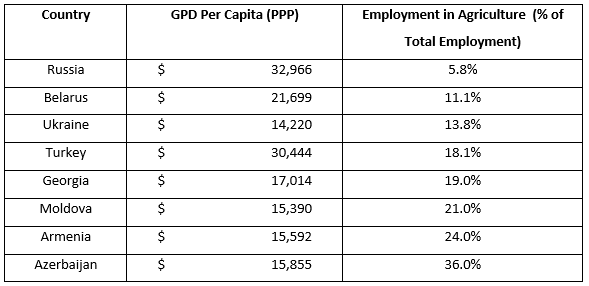
Source: World Bank; National Statistics Office of Georgia
Apart from employment, a good indicator for the success of a sector would be average labor remuneration and comparison with other sectors. According to the National Statistics Office of Georgia, average nominal salary for the hired employees in the agricultural sector was GEL 950 in 2021 and it was fifth from the bottom of other 18 employment sectors. Average median salary in the agricultural sector is even lower and equals GEL 800.
Table 5: Average Nominal Monthly Salary of the Hired Employees by Occupation, 2014-2021 (GEL)
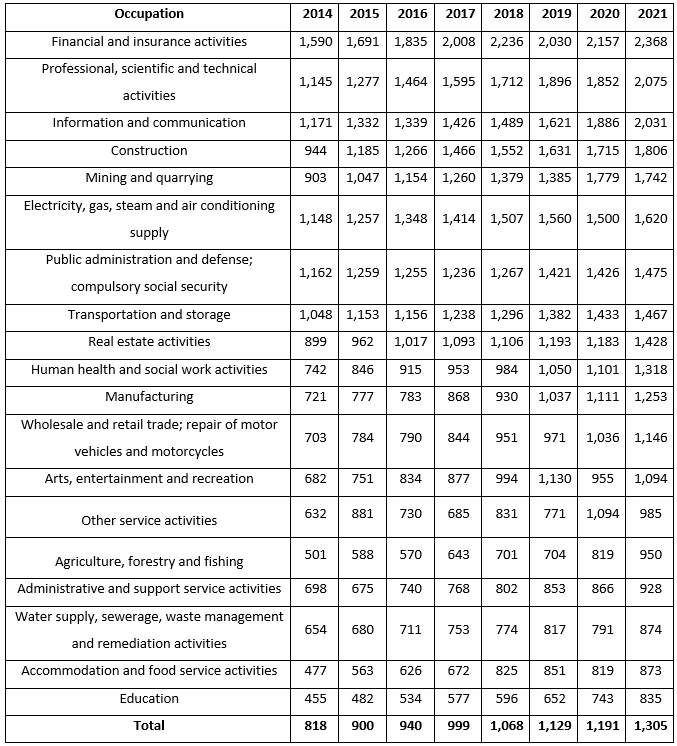
Source: National Statistics Office of Georgia
Table 6: Median Salary of Hired Employed Persons by Occupation, 2018-2021 (GEL)
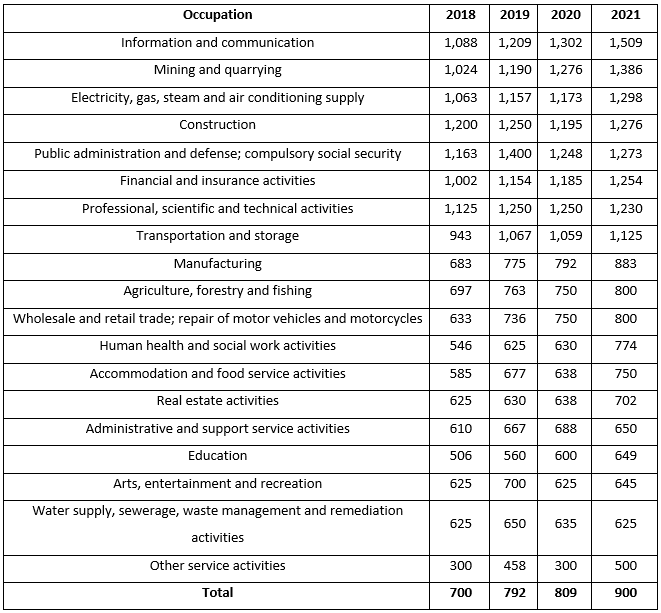
Source: National Statistics Office of Georgia
Table 5 and Table 6 illustrate that hired employees in the agricultural sector do not have higher salaries as compared to the hired employees of the other sectors. The situation is further complicated by the fact that 49% of those employed in rural areas are considered as self-employees and the level of average incomes is therefore lower. As of 2022 there were 259,700 self-employed persons in rural areas and 152,300 in urban areas.
Agricultural Sector’s Efficiency vis-à-vis the Other Sectors
Table 4 demonstrated that the agricultural sector’s growth rate is much lesser as compared to the country’s economic growth rate in general. In particular, in 2011-2022, real economic growth of the agricultural sector was 2.7% whereas average GDP growth rate in the same period was 1.74 times more at 4.7%.
In 2022, in terms of efficiency, there was a sharp misbalance in agriculture employment to agriculture’s share to GDP ratio. In particular, 19% of all employed people in the country – who are employed in the agricultural sector – generated merely 6.5% of the GDP whereas the rest 81% of employed persons generated other 93.5%. Given these figures, it is possible to conclude that on average other sectors were 3.4 times more efficient as compared to the agricultural sector.
There is virtually no correlation between inefficiency of agricultural sector and a country’s development level. Statistical correlation between these two variables is only 13%. There are rich countries where agricultural sector’s efficiency is higher and rich countries where it is not the case. For instance, Luxembourg is the top performer with GDP per capita at USD 133,000 and agricultural sector’s efficiency is 3.5 whereas in Singapore which ranks second in terms of GDP per capita with USD 116,486 has agricultural sector’s efficiency at 0.89. Table 5 and Table 6 show top 10 and bottom 10 countries in the world in terms of GDP per capita (PPP) and agricultural sector’s efficiency.
Table 7: Top 10 Countries – GDP Per Capita (PPP), 2021 and Inefficiency of Agricultural Sector
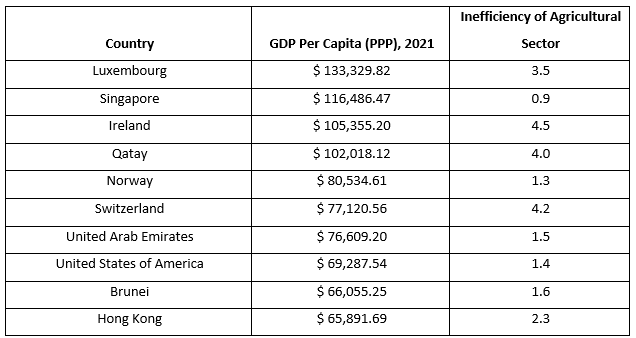
Source: World Bank; authors calculations
Table 8: Bottom 10 Countries – GDP Per Capita (PPP), 2021 and Inefficiency of Agricultural Sector
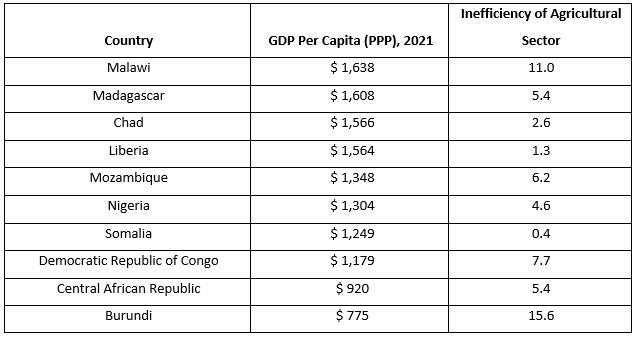
Source: World Bank; author’s calculations.
It is also worthy to note that comparison between different countries’ efficiency figures is less relevant because efficiency depends on how many people produce what part of wealth of a country. For instance, agricultural sector in Somalia is more efficient as compared to other sectors but this certainly does not mean that Somalia’s agricultural sector generates more wealth and products as compared to Ireland’s agricultural sector which is 4.5 times less efficient as compared to Ireland’s other sectors of the economy.
Average Farm Size
In a country’s economy, efficiency of any sector depends on scale of production it is capable to reach and to what extent does it have competitive advantage vis-à-vis other countries. Land size is one of the crucial factors in this regard. Since total area of arable land on earth is only 10.7% there are countries with abundance of arable lands and countries which lack those. For instance, according to the World Bank, Bangladesh (61%), Ukraine (59%), India (52%), Moldova (52%) and Togo (49%) have the highest arable land to total area ratio. In case of Georgia, this is 4.5% which is a low figure as compared to the most of the world countries.
Apart from arable land, another important element which contributes to the efficiency of agricultural sector is average farm size. There are 546,600 households in Georgia which own a land plot. Of that amount, the area of land under ownership of 79.6% of households is less than one hectare whereas 93.6% and 96.4% of those households own less than 2 and 3 hectares, respectively. Only 0.1% of households own lands that are 100 hectares and more in size. The less the land area owned by household, higher the unit cost because of economies of scale and consequently production becomes less efficient.
Average farm size in the United States of America was 180 hectares in 2021 whereas in Canada it was 327 hectares and in Australia 4,331 hectares. In 2016, average farm size in the European Union was 15.2 hectares which is nearly 15 times larger as compared to average farm size in Georgia in 2021. As of 2013, average farm sizes in the European Union member states were as follows:
Table 9: Average Farm Size in the European Union Member States, 2013
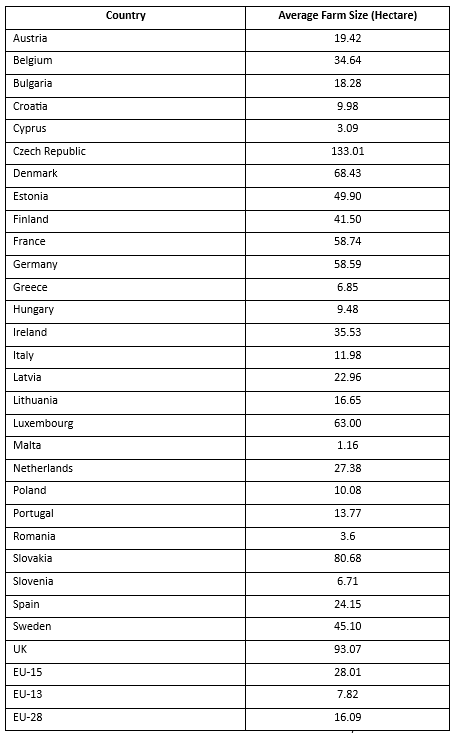
Source: The Past, Present and future of CAP – the Hungarian Viewpoint, Tamaz Mizik
Conclusion
There are many factors that are used for assessment of agricultural sector. Some of the major elements are the sector’s output, share in a country’s economy, real growth rate, number of employed people, their incomes, efficiency of the sector and average farm size indicators.
Nominal wealth generated by Georgia’s agricultural sector tends to grow, although its share in the economy has been shrinking year-by-year and dropped to 6.5% in 2022. The higher a country’s GDP growth is the lesser is the agricultural sector’s size to total economy ratio, because other and more efficient sectors have much higher growth rate. Therefore, reduction of share of the agricultural sector in Georgia’s economy is a normal process and it will contract even faster simultaneously with rapid economic development.
Real growth rate is another very important factor. In 2011-2022, agriculture in Georgia was growing by 2.7% on average whereas the economic growth rate was 4.7%. This means that the agriculture sector was 1.74 times less successful than the average.
Agricultural sector is one of the biggest employers in Georgia and in terms of revenues it provides some of the worst-paying jobs. Average monthly nominal salary for hired employees was GEL 950 in 2021 whereas average salary across the country was 37% more – GEL 1,305. The figures are more propitious if we take a look at median salary. In particular, average median income in the agricultural sector is GEL 800 whereas average figure across the country is 12.5% more – GEL 900.
In terms of efficiency, agricultural sector in Georgia is rather inefficient. In 2022 it was 3.4 times more inefficient as compared to average figure of the other sectors combined. Inefficiency of agricultural sector has a very weak correlation to a country’s development level across the world. Therefore, there are rich countries with inefficient agricultural sectors and poor countries where agricultural sector is more efficient as compared to the other sectors. However, this does not mean that “efficient” agricultural sector of a poor country is more efficient than “inefficient” agricultural sector of a rich country.
One of the main reasons behind unsuccessfulness of Georgia’s agricultural sector and the country in general is a small farm size which on average is approximately 1 hectare. In most of successful countries this indicator is much higher. For instance, as of 2016, average farm size in the European Union was 15.2 hectares.
Success of an agricultural sector depends on enlargement of average farm size which is most efficiently achieved naturally and it requires massive new investments in a country and high economic growth on the one hand. It also does require providing incentives to the people employed in agricultural sector on the other hand by encouraging them to find jobs and get involved in other sectors of economy that are more efficient than agriculture.
See the attached file for the entire document with relevant sources, links and explanations.
Gallery